Calendar An icon of a desk calendar. Cancel An icon of a circle with a diagonal line across. Caret An icon of a block arrow pointing to the right. Email An icon of a paper envelope. Facebook An icon of the Facebook "f" mark. Google An icon of the Google "G" mark. Linked In An icon of the Linked In "in" mark. Logout An icon representing logout. Profile An icon that resembles human head and shoulders. Telephone An icon of a traditional telephone receiver. Tick An icon of a tick mark. Is Public An icon of a human eye and eyelashes. Is Not Public An icon of a human eye and eyelashes with a diagonal line through it. Pause Icon A two-lined pause icon for stopping interactions. Quote Mark A opening quote mark. Quote Mark A closing quote mark. Arrow An icon of an arrow. Folder An icon of a paper folder. Breaking An icon of an exclamation mark on a circular background. Camera An icon of a digital camera. Caret An icon of a caret arrow. Clock An icon of a clock face. Close An icon of the an X shape. Close Icon An icon used to represent where to interact to collapse or dismiss a component Comment An icon of a speech bubble. Comments An icon of a speech bubble, denoting user comments. Comments An icon of a speech bubble, denoting user comments. Ellipsis An icon of 3 horizontal dots. Envelope An icon of a paper envelope. Facebook An icon of a facebook f logo. Camera An icon of a digital camera. Home An icon of a house. Instagram An icon of the Instagram logo. LinkedIn An icon of the LinkedIn logo. Magnifying Glass An icon of a magnifying glass. Search Icon A magnifying glass icon that is used to represent the function of searching. Menu An icon of 3 horizontal lines. Hamburger Menu Icon An icon used to represent a collapsed menu. Next An icon of an arrow pointing to the right. Notice An explanation mark centred inside a circle. Previous An icon of an arrow pointing to the left. Rating An icon of a star. Tag An icon of a tag. Twitter An icon of the Twitter logo. Video Camera An icon of a video camera shape. Speech Bubble Icon A icon displaying a speech bubble WhatsApp An icon of the WhatsApp logo. Information An icon of an information logo. Plus A mathematical 'plus' symbol. Duration An icon indicating Time. Success Tick An icon of a green tick. Success Tick Timeout An icon of a greyed out success tick. Loading Spinner An icon of a loading spinner. Facebook Messenger An icon of the facebook messenger app logo. Facebook An icon of a facebook f logo. Facebook Messenger An icon of the Twitter app logo. LinkedIn An icon of the LinkedIn logo. WhatsApp Messenger An icon of the Whatsapp messenger app logo. Email An icon of an mail envelope. Copy link A decentered black square over a white square.

Warwickshire named biggest speeding hotspot in England and Wales – study

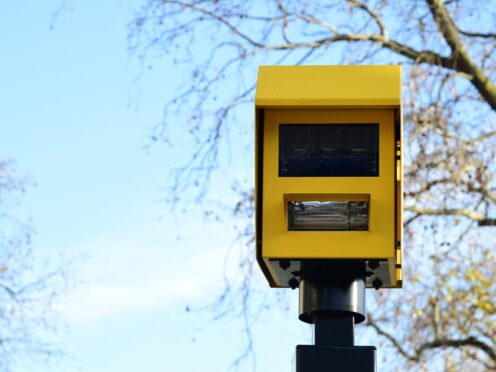
A speed camera in London.

Warwickshire has been named the ‘speeding hotspot’ of England and Wales, with a new study finding one in five drivers exceed speed limits in the county.

Warwickshire Police saw 91,325 speeding violations in 2022 – equivalent to one for every 4.58 vehicles in the area.

Go Compare Car Insurance’s findings – which used combined regional figures from the Home Office and the DVLA – located other speeding ‘hotspots’ including Greater London, Devon and Cornwall with the Met Police reporting one penalty for every 4.82 vehicles. Devon and Cornwall, meanwhile, saw one offence being issued for every 4.64 cars in the area.

Bedfordshire and Surrey both entered into the top ten – with speeding violations issued for every 8.18 and 9.14 respective vehicles – while Yorkshire was identified as another speedy area. Both North and West Yorkshire were in the top 10 list with penalties for every 6.26 and 6.49 vehicles respectively.

Tom Banks, a car insurance expert at Go.Compare, said: “Speeding is perhaps one of the most common safety risks associated with using our roads, so identifying the country’s hotspots is a key indicator of where the most dangerous places to drive are. It seems that the South is home to some of the nation’s worst areas, although the figures for Yorkshire are also particularly concerning.”

At the other end of the scale sat South Wales, where one offence was recorded for every 43 vehicles. North Wales also had a very low ratio, with one offence issued for every 21 vehicles.

Northumbria Police reported one offence for every 21.87 vehicles in the area it covers – Northumberland and Tyne and Wear – while Cleveland Police, which looks after Middlesborough, Hartlepool and Stockton, had a ratio of one offence for every 30 vehicles.